Let’s just assume dose-response is linear. So, go find what concentration of chemical X (medicine, food additive, cosmetic, whatever) kills 50% of the bacteria/rodent/etc population. Draw a line from there down to 0% dead at 0 concentration.
Now decide what % of deaths is acceptable, given the benefit of chemical X. Use the line we just drew and that tells you what the regulations should set for max concentration under as-directed usage.
This ignores facts like
response curves are very often literally curves, sometimes with more than 1 minimum
response curves (and lines!) often depend heavily on all sorts of other chemicals’ presence in the environment, in varying mixtures & amounts
It’s a combinatorial explosion we can never meaningfully test against. We do what we can, with the tools that we have.
Almost every signal response, and certainly in chemistry, is an S curve. A small span of that curve may be approximately linear, but you absolutely can not approximate the slope of that linear span by just the mid point.


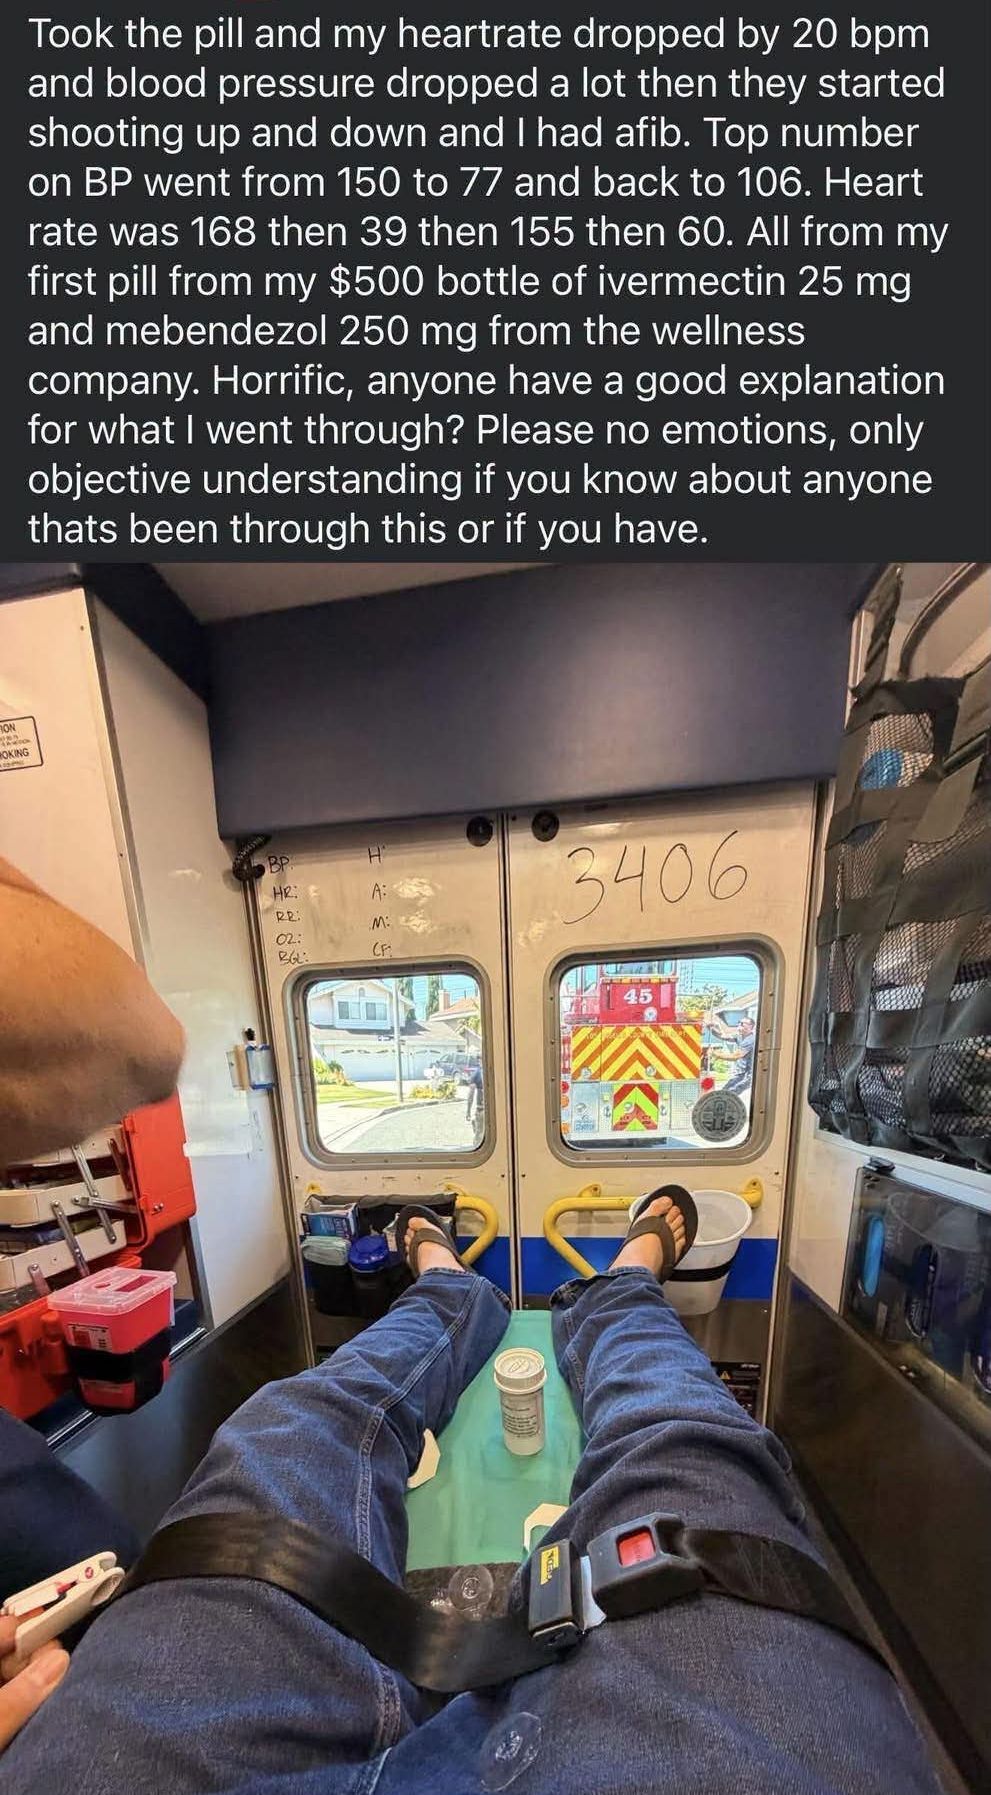
Oh God LD50 is the craziest thing ever.
Here’s how it works:
Let’s just assume dose-response is linear. So, go find what concentration of chemical X (medicine, food additive, cosmetic, whatever) kills 50% of the bacteria/rodent/etc population. Draw a line from there down to 0% dead at 0 concentration.
Now decide what % of deaths is acceptable, given the benefit of chemical X. Use the line we just drew and that tells you what the regulations should set for max concentration under as-directed usage.
This ignores facts like
It’s a combinatorial explosion we can never meaningfully test against. We do what we can, with the tools that we have.
Almost every signal response, and certainly in chemistry, is an S curve. A small span of that curve may be approximately linear, but you absolutely can not approximate the slope of that linear span by just the mid point.